Bounding rectangles in Python OpenCV
There are two methods in OpenCV to derive a bounding rectangle and extract the relevant values of an object or series of objects in an image.
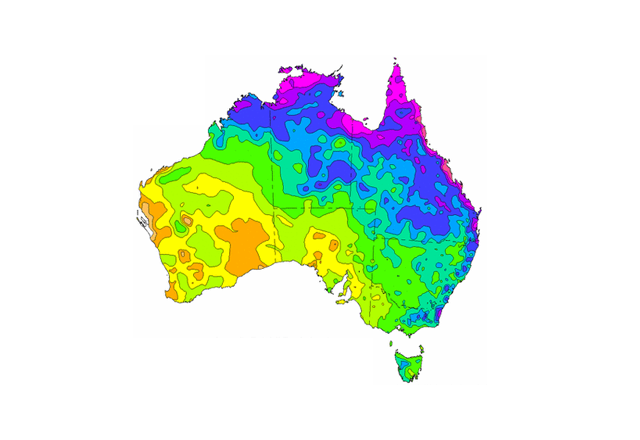
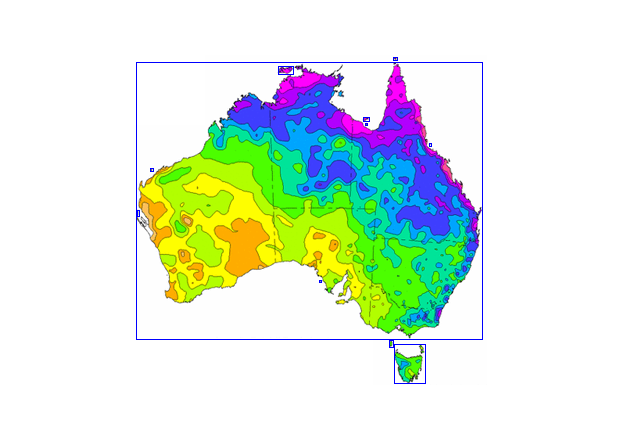
For both methods, it’s first necessary to obtain a binary image of the object of interest from an image. In this example, we’ll use a rainfall map of Australia (australia.png) created by the Bureau of Meteorology:
Several libraries are required for the following steps:
import cv2
import numpy as np
import matplotlib.pyplot as plt
To binarise this image, it first needs to be read-in and converted into greyscale:
filepath = "/path/to/australia.png"
australia = cv2.imread(filepath)
australia_grey = cv2.cvtColor(australia, cv2.COLOR_BGR2GRAY)
Next, the image needs to be thresholded to separate the foreground (object) from the background. The thresholding method and values will depend on the specific image, but it’s fairly straightforward in this example.
australia_thresh = cv2.threshold(australia_grey,226,255,cv2.THRESH_BINARY)[1]
australia_binary = cv2.bitwise_not(australia_thresh)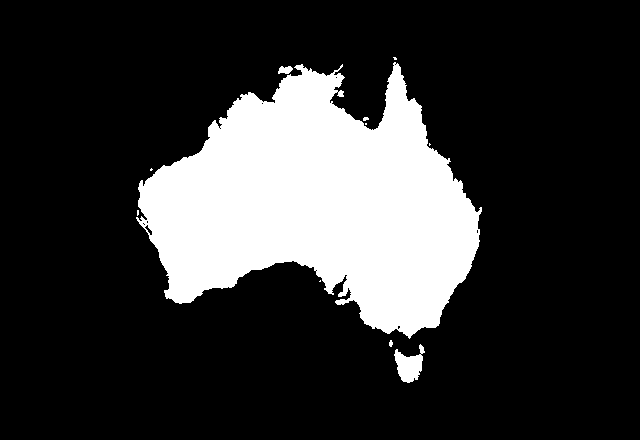
The binary image was inverted using the cv2.bitwise_not() function to ensure that the foreground is white. To view the binary image inline correctly via Jupyter Notebook, use the following code:
plt.imshow(australia_binary, cmap="gray", vmin=0, vmax=255)Depending on the purpose of the image analysis, there may be a desire to extract the dimension of a single bounding rectangle for the entire image (ie treat all objects as one), or alternatively identify each object individually. Let’s look at both options:
Treating all objects as one
To extract the minimum and maximum values of x and y in a binary image, the following code will do the job, where x1 is the minimum value of x, x2 is the maximum value of x, y1 is the minimum value of y and y2 is the minimum value of y.
# Generate variables
x1,y1,w,h = cv2.boundingRect(australia_binary)
x2 = x1+w
y2 = y1+h

# Draw bounding rectangle
start = (x1, y1)
end = (x2, y2)
colour = (255, 0, 0)
thickness = 1
rectangle_img = cv2.rectangle(australia, start, end, colour, thickness)
print("x1:", x1, "x2:", x2, "y1:", y1, "y2:", y2)
plt.imshow(rectangle_img, cmap="gray")
Here is the pictorial result:
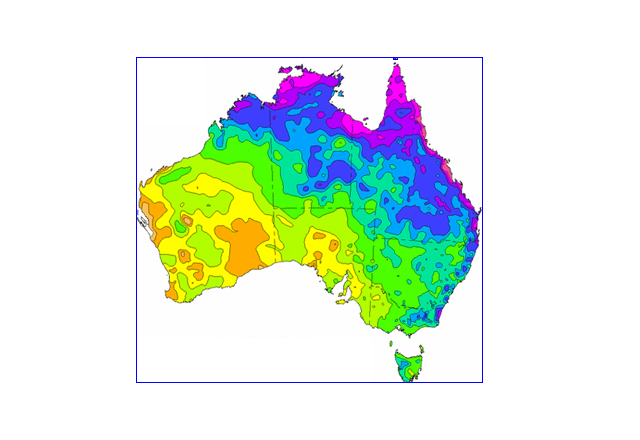
The print output is as follows, with values in pixels:
x1: 136 x2: 482 y1: 57 y2: 384Treating all objects separately
If the aim is to place a bounding box around each individual object, then the approach needs to be a little different. We still need to create a binary as above, but then use the following code:
# Multiple objects
result = australia.copy()
contours = cv2.findContours(australia_binary, cv2.RETR_EXTERNAL, cv2.CHAIN_APPROX_SIMPLE)
contours = contours[0] if len(contours) == 2 else contours[1]
colour = (255, 0, 0)
thickness = 1
i = 0
for cntr in contours:
    x1,y1,w,h = cv2.boundingRect(cntr)
    x2 = x1+w
    y2 = y1+h
    cv2.rectangle(result, (x1, y1), (x2, y2), colour, thickness)
    print("Object:", i+1, "x1:", x1, "x2:", x2, "y1:", y1, "y2:", y2)
    i += 1

plt.imshow(result)
The picture result is as follows:
The printed output is as follows:
Object: 1 x1: 394 x2: 425 y1: 344 y2: 383
Object: 2 x1: 389 x2: 393 y1: 340 y2: 347
Object: 3 x1: 319 x2: 321 y1: 280 y2: 282
Object: 4 x1: 137 x2: 139 y1: 210 y2: 216
Object: 5 x1: 150 x2: 153 y1: 168 y2: 171
Object: 6 x1: 429 x2: 431 y1: 143 y2: 146
Object: 7 x1: 365 x2: 367 y1: 123 y2: 125
Object: 8 x1: 363 x2: 369 y1: 117 y2: 121
Object: 9 x1: 278 x2: 293 y1: 66 y2: 74
Object: 10 x1: 136 x2: 482 y1: 62 y2: 339
Object: 11 x1: 393 x2: 397 y1: 57 y2: 60
Eleven objects have been identified and the relevant properties reported:
- Mainland Australia
- Mainland Tasmania
- King Island, Tasmania
- Flinders Island, South Australia
- Dirk Hartog Island, Western Australia
- Barrow Island, Western Australia
- Tiwi Islands, Northern Territory
- Mornington Island, Queensland
- Bentinck Island, Queensland
- Whitsundays, Queensland
- Torres Strait Islands, Queensland
You will notice that some islands have been missed such as the Furneaux Group (Tasmania), Kangaroo Island (South Australia) and Groote Eyelandt (Northern Territory). Improved thresholding and binarisation steps could help improve accuracy, but the general point is demonstrated sufficiently.
Comments
No comments have yet been submitted. Be the first!